The official site of The Campbell Real Estate Timing Letter
How to Identify the Peaks and Valleys of Real Estate Cycles
(No Crystal Ball Needed)
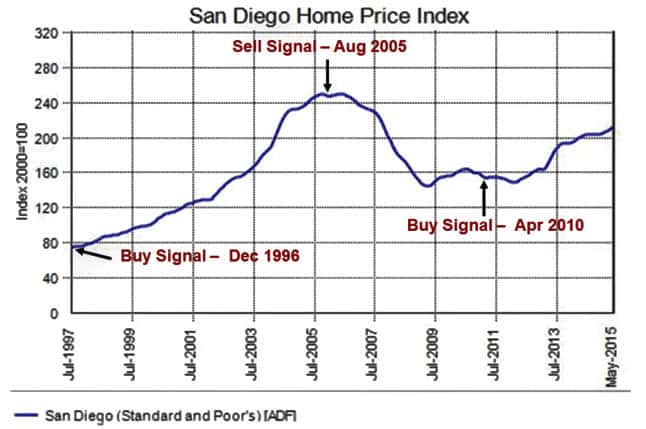
History of buy and sell signals over a 19 year period
Using Robert Campbell’s real estate timing model in the late 1990s’, the above chart shows the last three buy and sell signals that were generated for the San Diego housing market. The price chart is from Case-Shiller, and goes from 1997 to 2015.
Robert does not have a crystal ball. Instead he uses a timing model he created that is based on five key indicators (i.e. hard data) that Campbell calls “Vital Signs” — which act as an early warning system to major trend changes in the market.
“How early?” you ask. You are typically given 3-6 months of advance notice before major trend changes occur, which is long before they become obvious to the general public.
These five key real estate indicators tell a clear story – and “if you pay close attention to them,” says Campbell, “nobody can say they were caught by surprise.”
Campbell’s Real Estate Timing Letter tracks the trends for 19 major U.S. cities – five of which are in California. The goal is to get you in at the bottom and out at the top of major, long-term market moves.
To buy Robert’s book and learn how to create a real estate timing model for your city, CLICK HERE.
To subscribe to The Campbell Real Estate Timing Letter and get Robert’s book for FREE, CLICK HERE.