
As many of my followers know, I use chart patterns and momentum to help make market timing decisions.
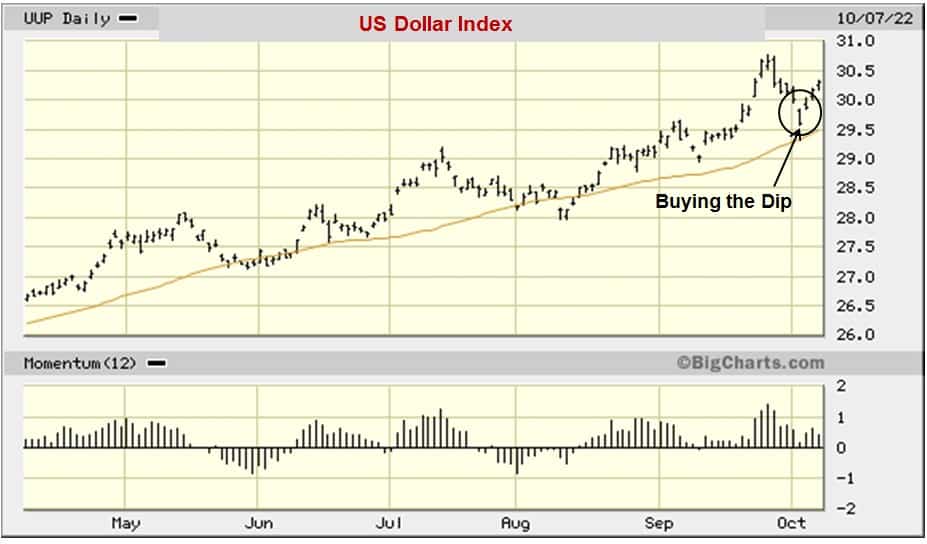
To illustrate, look at the chart of the US Dollar Index that is featured above.
As a result of the Fed raising interest rates to fight inflation, the US Dollar Index has risen 15% in the last six months.
Why is this Happening?
It’s because the US Dollar gets stronger when rates are rising – and weaker when rates are falling.
This well-defined uptrend in the US Dollar Index reflects this correlation.
Buying the Dip
Thus, when the USD Index sold off after a big up move in the two weeks prior, I used chart patterns and momentum analysis to make the timing decision to “buy the dip” on October 4, 2022.
My decision to buy that day was not based on personal opinions.
Instead, my “buy” decision on 10-4-2022 was based primarily on historical probabilities that were solidly in my favor.
It’s like how a gambler can tip the odds in his favor if he learns how to “count cards” in Blackjack.
Whether you invest in securities or real estate, you can learn from history. Life is short, folks. Use everything you can to your advantage.
::::::
SUBSCRIBE TO REAL ESTATE TIMING LETTER