
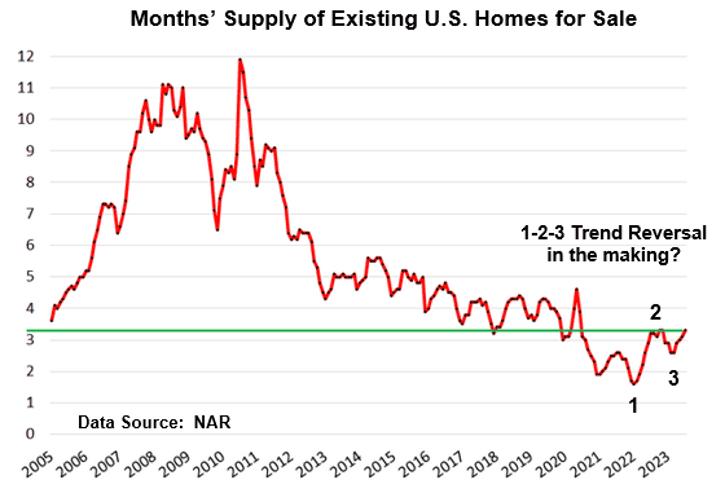
[The above chart was presented in my Sept 2023 Timing Letter, as was the following transcript:]
“Based on the 1-2-3 chart pattern shown in the chart, odds are high that more months’ supply of homes for sale is going to start hitting the market in the months (and maybe years) ahead.”
“If month’s supply breaks above 3.3 months, that would signal that a trend-reversal to the upside has likely occurred.”
JUST IN: Months’ supply was at 3.3 months in August – same as in July. Thus, no upside breakout yet.
::::::