
[Taken from July 2021 Timing Letter]
If you dig into the specific components that determine core CPI-U in the U.S. – which does not exclude food and energy – you’ll find that housing costs represents a good chunk of it – namely 40% of the index.
That’s why housing costs are far more critical for the direction of U.S. inflation – and not the crazy price increases we’ve seen in gasoline, used cars and lumber that the media focuses on.
To measure housing costs, please know that the Bureau of Labor Statistics does not use actual housing prices – but instead uses Owner’s Equivalent Rent (OER) and Rent of Primary Residence to represent the cost of housing in their Consumer Price Indexes.
The rate of inflation lags growth in home prices
by roughly 18 months
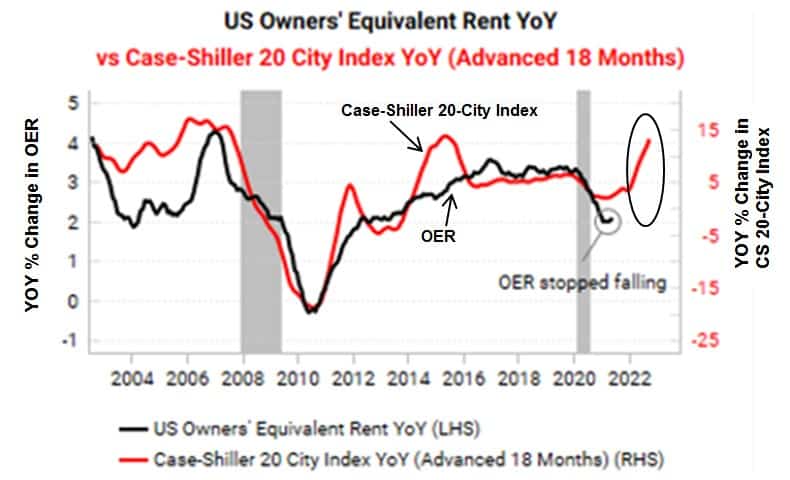
These two housing cost components have been tame so far – but are likely getting ready to roar. This is because they typically lag the growth in home prices by about 18 months.
The chart that is shown above plots OER against the Case-Shiller 20 City Index that has been advanced by 18 months. Since 2004, you can see this series has been generally well-correlated.
The OER stopped falling in May 2021 and is now poised to start rising and playing catch-up with the rapidly climbing 20-City Index – which rose 14.9% YOY in April.
Said differently, the red-hot housing market data is yet to find its way into the CPI-U readings – and may not be fully captured for another year given the 18 month lag.
We could therefore see even higher rates of inflation in the months and years ahead.
:::::::
October 23, 2021 Seminar:
“Is Inflation Knocking on the Door? Or Is Deflation?”
Only 34 Seats Still Available